Objective
The objective of the project was to optimize placement of street teams, based on MTA Turnstile Data, to collect most signatures for organizing a fundraiser gala, in Summer 2020, to raise awareness about women in technology.
**-link to image site.
Assumptions
It can be assumed that placing street teams on stations that are heavily trafficked stations will give us the best opportunity to collect the most signatures. On weekdays, commuter traffic at MTA’s were considerably larger than the tourist commuters. Turnstile data for the periods between May 2019 and June 2019 is a good representation of the NYC resident commuters during summer, and will give us an idea of the number of residents that will be in the city during the summer.
Data
MTA turnstile data was obtained for the period, between May 2019 and June 201, from the MTA website. The data contains the entries and exits for each turnstile recorded ever 4 to 6 hours, depending upon the station. Each row in the data corresponds to the data entry from a particular turnstile at a given point in time.
Approach
We took a two pronged approach to solve this problem. First, we explored the MTA turnstile data to identify the top 6 stations that have a heavy daily traffic. Once could then place their street teams at these locations throughout the day. In case of, minimal volunteer turnout, we focussed on the hourly traffic.
Secondly, we focussed on the NYC demographics to identify potential zip codes which have a high potential to contribute to this cause.
Methodology
Used Python as the programming language for this project, Pandas and Numpylibraries to process the dataframes, Matplotlib, Seaborn, and Folium libraries for generating the plots. The data was cleaned - by removing the duplicate entries and outliers.
Results
The top 6 stations that showed the highest number of entries on the days explored is shown in the Table 1. Figure 1, shows the box plot of the variation in the data. It can be seen that the variability in the number of entries data is not significant.
Table 1. Top 6 MTA stations, that recorded the highest daily entries in the period between May 2019 and June 2019.
Figure 1. Box plot showing a summary of the daily entries for the top 6 stations in NYC.
Figure 2. Shows the locations of the top 6 heavily trafficked stations, based on (A) exits in the morning and (B) entries in the evening. It can be seen that all the 6 stations are in the Manhattan region of NYC. This makes sense as it is the borough with the highest population. It can also be observed that, the exit turnstiles were heavily trafficked during the morning, while the entry turnstiles were heavily trafficked during the evening hours. The stations corresponding to the heavily trafficked entry turnstiles in the evening and exit turnstiles in the morning are the same. This can be explained from the fact that the most offices are located around these stations. Therefore during the day thus people going to work are leaving these stations, use the exit turnstiles. While, in the evening, people are going back home from these locations, use the entry turnstiles.
Figure 2. Map of NYC indicating the location of heavily trafficked stations. (A) shows the stations that recorded the highest exits in the morning and (B) shows the stations that had the highest entries during the evening. The size of the bubble is directly proportional to the daily total number of people using the turnstiles.
From Figure 3, it can be seen that weekdays recorded the highest MTA riderships correspond, while the weekends saw a lower traffic.
Figure 3. shows the fluctuations in the daily ridership for Penn Station during the month of May 2019.
Table 2, shows the top 6 highly trafficked stations on a 3 hour basis.
Table2. Optimized list of stations showing the highest hourly metro ridership in the period between May 2019 and June 2019.
Conclusion
In case of a bigger volunteer turnout, we suggest that street canvassing teams be placed at the top 6 locations on weekdays at all times during the day. Alternatively, for a low volunteer turnout we would advice a mobile team that would move every 3 hours, depending on the hour, to the station listed in Table 2 on a weekday.
For more information on the impact of demographics on the allocation of campaign resources, please see my team mate Rita Biagioli’s blog
Appendix A
Figure A1. showing the fluctuation of traffic for every 3 hours on a weekday, for the top 6 stations discussed in the main text.
*- Title image was borrowed from NewYorker magazine.
**-Image was borrowed from Thrillist.com(https://www.thrillist.com/lifestyle/new-york/l-train-shutdown-nyc-mta-plan-alternative-service)
My name is Samy Palaniappan and I am a curious engineer. In this blog, I describe my exploration into the world of data science. The purpose of this blog is to illustrate my learning experiences as I wander into this vast jungle of data with untapped knowledge. In this process, I hope to create a repository of information, that will help navigate any new and brave venturers aspiring to enter this field after spending a long time in any other field, such as myself.
Before, I go and describe my experiences, I would like to tell you a bit about myself. I am an engineer and I have a PhD in this field. I also have 6 years of post-graduate work experience including 4 years in the industry as a process engineer and two years as a postdoctoral fellow. Most of my work has been in the fields of electrochemistry, chemicals, and materials engineering. During this time as a researcher, I did a lot of experimental design, experiments, data analysis, writing, and presenting.
Why data science, and why now ?
After spending so long in electrochemistry and materials research i got good at it, however I also became tired of doing the same thing over and over. So, it was time to bid adieu(temporary or permanent, is to be seen) to my old friends Butler, Volmer, Nernst, Navier, and Stoke’s. Also, 10 years in research, was not enough for me take a liking to the dry nature of academic writing. That said, I can vividly recollect my inner joy during the data analysis part of all my project. Trying to find the underlying meaning in the data gave me the kicks. Needless, to say I enjoyed every bit of it. My curiosity to find the story behind the data and the proclivity to modeling and simulation could explain my inclination to learning the field. I also tried semiconductor and nanoscience, there were number two and three on my list. Unlike the last time, i had a thorough decision making process, where I spoke with a number of people with similar backgrounds, recruiters, as well as my friends, and family. I hope to detail, this in one of the upcoming blogs in the coming weeks. As for the timing, why NOT now ? I only hope it is not too late, to get on this gravy train.
My approach
I took courses on basic Python on LinkedIn Learning, IBM data analysis and data visualization with Python on Coursera, and working with Pandas in Python on Udemy. One month later, I realized that my learning was slower than I preferred and i required a structured program to accelerate the learning process. So, i looked into the bootcamps in data science programs. It seemed ideal for me, as it was setup to offer intense training in coding and all the required tools required for a data scientist within a span of 3 months.
I did some background research on the existing bootcamps offering datascience courses (There are about a dozen of them). It finally came down to (1) Metis, (2) Galvanize, (3) Insight, and (4) Springboard. After speaking to a couple of alumni, I decided upon Metis. I chose Metis, mainly for a few reasons: (1) They specifically focussed on Data Science and they seem to do exceptionally well,(2) They had live bootcamps, and (3) They had a cohort starting within a month. I took the hacker rank admissions test, which included about 7 coding challenges and 29 questions in subjects ranging from probability and statistics, linear algebra, and calculus. They also had a remote interview via zoom, which was more of a discussion for them to find out more about myself and my motivations for the course. I received my acceptance email shortly afterwards. They immediately provided me with all the necessary material with the necessary material for the 60 hour prebootcamp work.
The Program
At this time, i have already been one week into the program. I have submitted myself to the capable minds of John Tate, Lara Kattan, Alice Zhao, and Google. It has been an intense week, where we dived into the concepts of:
Basic Python, Datatypes Tuples, Lists, Sets, and Arrays. Manipulating series and dataframes with Pandas and Numpy. Plotting with Matplotlib and Seaborn
Advanced datatypes such as DefaultDict, NamedTuples, and Deques.
Advanced python concepts of Complexity Evaluation and the Big O notation, Generators, Pickle, and Shallow / Deep Copy
How to navigate and use Git and Git Hub to ensure version control is done appropriately.
Do’s and Dont’s of coding.
So far, I completed a project on Exploratory Data Analysis project on NYC MTA turnstile data with my team mates Stephen Schneider and Rita Biagioli. I also solved ten challenges on data analysis which, I pushed into our cohort repository. In the coming weeks I look forward to transferring to you at least a tenth of my excitement, my curiosity, and interesting bits in machine learning, distributed computing, etc. As i go through with this course, I expect to document my fascinations, joy, trials, and tribulations that I experience. More importantly, you will be reading about my experiment, the outcomes, and what I will be doing with this newfound knowledge.
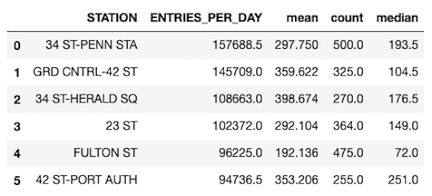
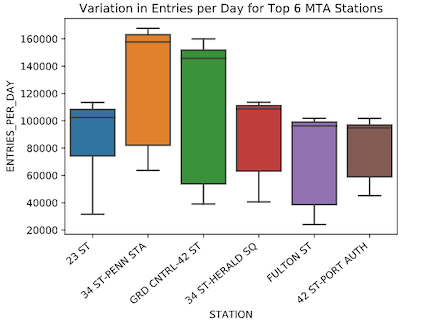
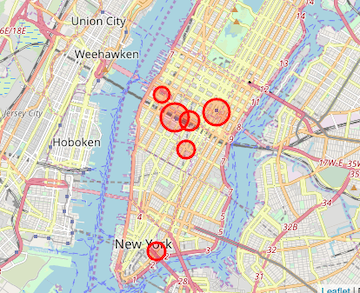
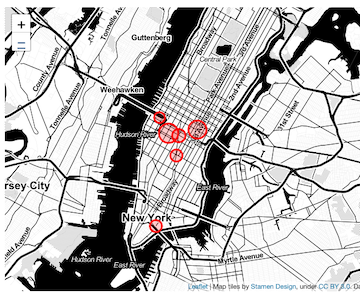
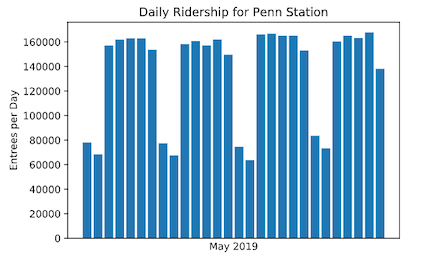
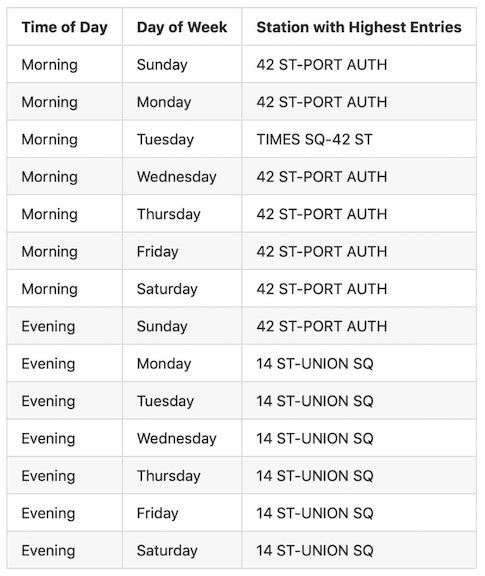
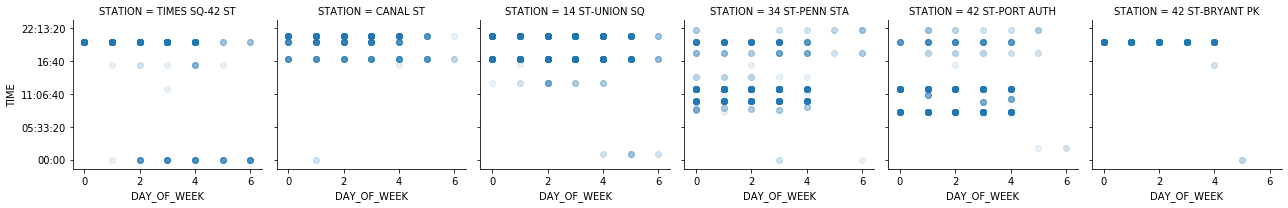 Figure A1. showing the fluctuation of traffic for every 3 hours on a weekday, for the top 6 stations discussed in the main text.